資訊專欄INFORMATION COLUMN

小編寫這篇文章的主要目的,是給大家去做一個(gè)介紹,介紹關(guān)于Python pyecharts繪制地理圖標(biāo)的方法,下面會(huì)給大家去羅列一個(gè)一個(gè)的步驟,將這些具體的內(nèi)容,給大家去一一的展示出來,就具體的內(nèi)容,下面就給大家詳細(xì)解答下。
炫酷地圖
前期我們介紹了很多的地圖模板,不管是全球的還是中國(guó)的,其實(shí)我感覺都十分的炫酷,哈哈哈,可是還有更加神奇的,更加炫酷的地圖模板,下面讓我們一起一飽眼福吧!
3D炫酷地圖模板系列
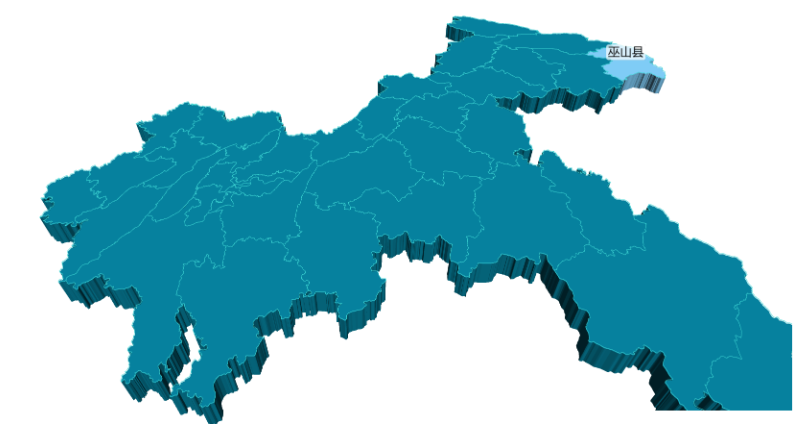
重慶市3D地圖展示
  from pyecharts import options as opts
  from pyecharts.charts import Map3D
  from pyecharts.globals import ChartType
  #經(jīng)緯度
  example_data=[
  [[119.107078,36.70925,1000],[116.587245,35.415393,1000]],
  [[117.000923,36.675807],[120.355173,36.082982]],
  [[118.047648,36.814939],[118.66471,37.434564]],
  [[121.391382,37.539297],[119.107078,36.70925]],
  [[116.587245,35.415393],[122.116394,37.509691]],
  [[119.461208,35.428588],[118.326443,35.065282]],
  [[116.307428,37.453968],[115.469381,35.246531]],
  ]
  c=(
  Map3D(init_opts=opts.InitOpts(width="1400px",height="700px"))
  .add_schema(
  maptype="重慶",
  itemstyle_opts=opts.ItemStyleOpts(
  color="rgb(5,101,123)",
  opacity=1,
  border_width=0.8,
  border_color="rgb(62,215,213)",
  ),
  light_opts=opts.Map3DLightOpts(
  main_color="#fff",
  main_intensity=1.2,
  is_main_shadow=False,
  main_alpha=55,
  main_beta=10,
  ambient_intensity=0.3,
  ),
  view_control_opts=opts.Map3DViewControlOpts(center=[-10,0,10]),
  post_effect_opts=opts.Map3DPostEffectOpts(is_enable=False),
  )
  .add(
  series_name="",
  data_pair=example_data,
  type_=ChartType.LINES3D,
  effect=opts.Lines3DEffectOpts(
  is_show=True,
  period=4,
  trail_width=3,
  trail_length=0.5,
  trail_color="#f00",
  trail_opacity=1,
  ),
  linestyle_opts=opts.LineStyleOpts(is_show=False,color="#fff",opacity=0),
  )
  .set_global_opts(title_opts=opts.TitleOpts(title="Map3D"))
  .render("區(qū)縣3D地圖.html")
  )
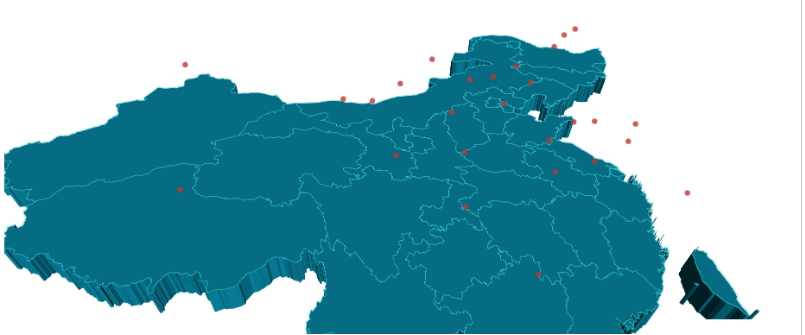
中國(guó)3D地圖
數(shù)組里面分別代表:經(jīng)緯度,數(shù)值
  from pyecharts import options as opts
  from pyecharts.charts import Map3D
  from pyecharts.globals import ChartType
  from pyecharts.commons.utils import JsCode
  example_data=[
  ("黑龍江",[127.9688,45.368,100]),
  ("內(nèi)蒙古",[110.3467,41.4899,100]),
  ("吉林",[125.8154,44.2584,100]),
  ("遼寧",[123.1238,42.1216,100]),
  ("河北",[114.4995,38.1006,100]),
  ("天津",[117.4219,39.4189,100]),
  ("山西",[112.3352,37.9413,100]),
  ("陜西",[109.1162,34.2004,100]),
  ("甘肅",[103.5901,36.3043,100]),
  ("寧夏",[106.3586,38.1775,100]),
  ("青海",[101.4038,36.8207,100]),
  ("新疆",[87.9236,43.5883,100]),
  ("西藏",[91.11,29.97,100]),
  ("四川",[103.9526,30.7617,100]),
  ("重慶",[108.384366,30.439702,100]),
  ("山東",[117.1582,36.8701,100]),
  ("河南",[113.4668,34.6234,100]),
  ("江蘇",[118.8062,31.9208,100]),
  ("安徽",[117.29,32.0581,100]),
  ("湖北",[114.3896,30.6628,100]),
  ("浙江",[119.5313,29.8773,100]),
  ("福建",[119.4543,25.9222,100]),
  ("江西",[116.0046,28.6633,100]),
  ("湖南",[113.0823,28.2568,100]),
  ("貴州",[106.6992,26.7682,100]),
  ("廣西",[108.479,23.1152,100]),
  ("海南",[110.3893,19.8516,100]),
  ("上海",[121.4648,31.2891,100]),
  ]
  c=(
  Map3D(init_opts=opts.InitOpts(width="1400px",height="700px"))
  .add_schema(
  itemstyle_opts=opts.ItemStyleOpts(
  color="rgb(5,101,123)",
  opacity=1,
  border_width=0.8,
  border_color="rgb(62,215,213)",
  ),
  map3d_label=opts.Map3DLabelOpts(
  is_show=False,
  formatter=JsCode("function(data){return data.name+""+data.value[2];}"),
  ),
  emphasis_label_opts=opts.LabelOpts(
  is_show=False,
  color="#fff",
  font_size=10,
  background_color="rgba(0,23,11,0)",
  ),
  light_opts=opts.Map3DLightOpts(
  main_color="#fff",
  main_intensity=1.2,
  main_shadow_quality="high",
  is_main_shadow=False,
  main_beta=10,
  ambient_intensity=0.3,
  ),
  )
  .add(
  series_name="Scatter3D",
  data_pair=example_data,
  type_=ChartType.SCATTER3D,
  bar_size=1,
  shading="lambert",
  label_opts=opts.LabelOpts(
  is_show=False,
  formatter=JsCode("function(data){return data.name+''+data.value[2];}"),
  ),
  )
  .set_global_opts(title_opts=opts.TitleOpts(title="Map3D"))
  .render("中國(guó)3D地圖.html")
  )
中國(guó)3D數(shù)據(jù)地圖(適合做數(shù)據(jù)可視化)
如果說前面的那個(gè)你看起來不太舒服,那么這個(gè)絕對(duì)適合做數(shù)據(jù)可視化展示喲!
  from pyecharts import options as opts
  from pyecharts.charts import Map3D
  from pyecharts.globals import ChartType
  from pyecharts.commons.utils import JsCode
  example_data=[
  ("黑龍江",[127.9688,45.368,100]),
  ("內(nèi)蒙古",[110.3467,41.4899,300]),
  ("吉林",[125.8154,44.2584,300]),
  ("遼寧",[123.1238,42.1216,300]),
  ("河北",[114.4995,38.1006,300]),
  ("天津",[117.4219,39.4189,300]),
  ("山西",[112.3352,37.9413,300]),
  ("陜西",[109.1162,34.2004,300]),
  ("甘肅",[103.5901,36.3043,300]),
  ("寧夏",[106.3586,38.1775,300]),
  ("青海",[101.4038,36.8207,300]),
  ("新疆",[87.9236,43.5883,300]),
  ("西藏",[91.11,29.97,300]),
  ("四川",[103.9526,30.7617,300]),
  ("重慶",[108.384366,30.439702,300]),
  ("山東",[117.1582,36.8701,300]),
  ("河南",[113.4668,34.6234,300]),
  ("江蘇",[118.8062,31.9208,300]),
  ("安徽",[117.29,32.0581,300]),
  ("湖北",[114.3896,30.6628,300]),
  ("浙江",[119.5313,29.8773,300]),
  ("福建",[119.4543,25.9222,300]),
  ("江西",[116.0046,28.6633,300]),
  ("湖南",[113.0823,28.2568,300]),
  ("貴州",[106.6992,26.7682,300]),
  ("廣西",[108.479,23.1152,300]),
  ("海南",[110.3893,19.8516,300]),
  ("上海",[121.4648,31.2891,1300]),
  ]
  c=(
  Map3D(init_opts=opts.InitOpts(width="1400px",height="700px"))
  .add_schema(
  itemstyle_opts=opts.ItemStyleOpts(
  color="rgb(5,101,123)",
  opacity=1,
  border_width=0.8,
  border_color="rgb(62,215,213)",
  ),
  map3d_label=opts.Map3DLabelOpts(
  is_show=False,
  formatter=JsCode("function(data){return data.name+""+data.value[2];}"),
  ),
  emphasis_label_opts=opts.LabelOpts(
  is_show=False,
  color="#fff",
  font_size=10,
  background_color="rgba(0,23,11,0)",
  ),
  light_opts=opts.Map3DLightOpts(
  main_color="#fff",
  main_intensity=1.2,
  main_shadow_quality="high",
  is_main_shadow=False,
  main_beta=10,
  ambient_intensity=0.3,
  ),
  )
  .add(
  series_name="數(shù)據(jù)",
  data_pair=example_data,
  type_=ChartType.BAR3D,
  bar_size=1,
  shading="lambert",
  label_opts=opts.LabelOpts(
  is_show=False,
  formatter=JsCode("function(data){return data.name+''+data.value[2];}"),
  ),
  )
  .set_global_opts(title_opts=opts.TitleOpts(title="城市數(shù)據(jù)"))
  .render("帶有數(shù)據(jù)展示地圖.html")
  )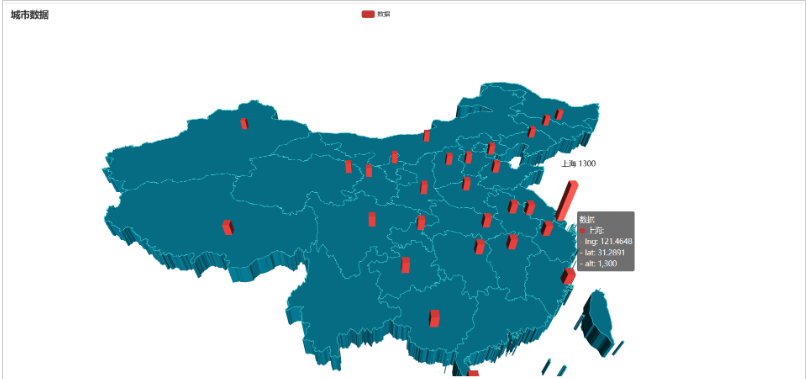
看完直呼這個(gè)模板,適合做城市之間的數(shù)據(jù)對(duì),同時(shí)也展示了經(jīng)緯度。
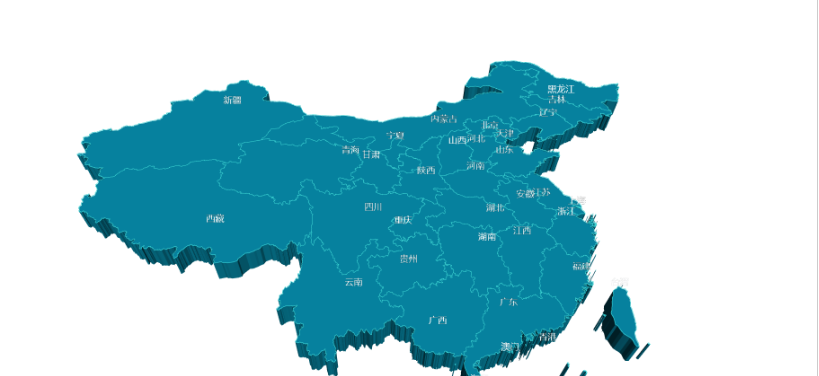
全國(guó)行政區(qū)地圖(帶城市名字)
  from pyecharts import options as opts
  from pyecharts.charts import Map3D
  from pyecharts.globals import ChartType
  c=(
  Map3D(init_opts=opts.InitOpts(width="1400px",height="700px"))
  .add_schema(
  itemstyle_opts=opts.ItemStyleOpts(
  color="rgb(5,101,123)",
  opacity=1,
  border_width=0.8,
  border_color="rgb(62,215,213)",
  ),
  map3d_label=opts.Map3DLabelOpts(
  is_show=True,
  text_style=opts.TextStyleOpts(
  color="#fff",font_size=16,background_color="rgba(0,0,0,0)"
  ),
  ),
  emphasis_label_opts=opts.LabelOpts(is_show=True),
  light_opts=opts.Map3DLightOpts(
  main_color="#fff",
  main_intensity=1.2,
  is_main_shadow=False,
  main_alpha=55,
  main_beta=10,
  ambient_intensity=0.3,
  ),
  )
  .add(series_name="",data_pair="",maptype=ChartType.MAP3D)
  .set_global_opts(
  title_opts=opts.TitleOpts(title="全國(guó)行政區(qū)劃地圖-Base"),
  visualmap_opts=opts.VisualMapOpts(is_show=False),
  tooltip_opts=opts.TooltipOpts(is_show=True),
  )
  .render("全國(guó)標(biāo)簽地圖.html")
  )
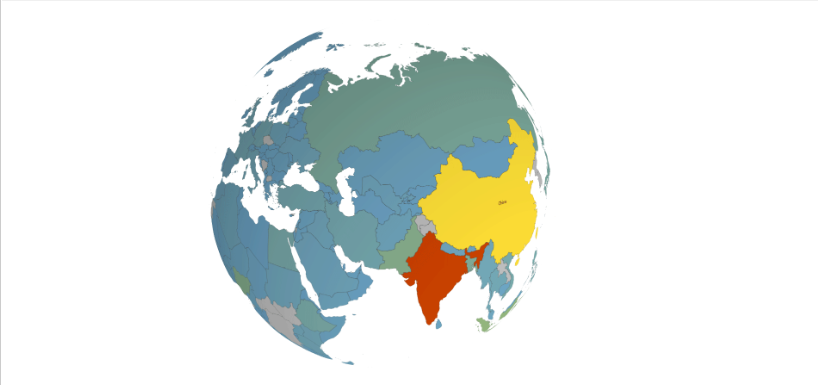
地球展示
  import pyecharts.options as opts
  from pyecharts.charts import MapGlobe
  from pyecharts.faker import POPULATION
  data=[x for _,x in POPULATION[1:]]
  low,high=min(data),max(data)
  c=(
  MapGlobe(init_opts=opts.InitOpts(width="1400px",height="700px"))
  .add_schema()
  .add(
  maptype="world",
  series_name="World Population",
  data_pair=POPULATION[1:],
  is_map_symbol_show=False,
  label_opts=opts.LabelOpts(is_show=False),
  )
  .set_global_opts(
  visualmap_opts=opts.VisualMapOpts(
  min_=low,
  max_=high,
  range_text=["max","min"],
  is_calculable=True,
  range_color=["lightskyblue","yellow","orangered"],
  )
  )
  .render("地球.html")
) 
其實(shí)pyecharts還可以做百度地圖,可以縮放定位到每一個(gè)區(qū)域,但是其實(shí)我們?cè)谌粘I钪锌赡苡貌簧希绻每梢匀グ俣鹊貓D展示效果或者學(xué)習(xí)練習(xí)也是可的
到此為止,這篇文章就給大家介紹完畢了,希望可以給大家?guī)韼椭?/p>
文章版權(quán)歸作者所有,未經(jīng)允許請(qǐng)勿轉(zhuǎn)載,若此文章存在違規(guī)行為,您可以聯(lián)系管理員刪除。
轉(zhuǎn)載請(qǐng)注明本文地址:http://specialneedsforspecialkids.com/yun/128277.html
python使用場(chǎng)景還是很多的,特別是在實(shí)現(xiàn)自動(dòng)化的辦公階段,python的用處是比較的大的,那么,今天又有一個(gè)比較新奇的想法,如何使用python中的pyecharts去畫一個(gè)中國(guó)地圖呢?下面給各位讀者做一個(gè)詳細(xì)介紹。 在這一個(gè)月的時(shí)間里,利用網(wǎng)絡(luò)爬蟲爬取了杭州所有二手房的一個(gè)數(shù)據(jù),在作圖的時(shí)候發(fā)現(xiàn)在地圖呈現(xiàn)上還是有欠缺,這里就把用到的貼出來,提升一下記憶。 之前有接觸用Basemap繪...
小編寫這篇文章的主要目的,主要是給大家去做一個(gè)解答,解答的內(nèi)容主要是關(guān)于Python pyecharts的一些案例,包括如何使用它去進(jìn)行繪制一個(gè)相關(guān)的散點(diǎn)圖,怎么能夠快速的去進(jìn)行繪制。就具體的內(nèi)容,下面就給大家詳細(xì)解答下。 什么是散點(diǎn)圖? 散點(diǎn)圖是指在數(shù)理統(tǒng)計(jì)回歸分析中,數(shù)據(jù)點(diǎn)在直角坐標(biāo)系平面上的分布圖,散點(diǎn)圖表示因變量隨自變量而變化的大致趨勢(shì),由此趨勢(shì)可以選擇合適的函數(shù)進(jìn)行經(jīng)驗(yàn)分布的擬合...
小編寫這篇文章的一個(gè)主要目的,繼續(xù)為大家介紹關(guān)于Python相關(guān)事宜,介紹的內(nèi)容主要是教我們?nèi)绾稳ダL制餅狀圖,具體怎么去做呢?下面就給大家詳細(xì)的解答下。 概念 餅圖(pie chart)是用圓形及圓內(nèi)扇形的角度來表示數(shù)值大小的圖形,它主要用于表示一個(gè)樣本(或總體)中各組成部分的數(shù)據(jù)占全部數(shù)據(jù)的比例。僅排列在工作表的一列或一行中的數(shù)據(jù)可以繪制到餅圖中。餅圖顯示一個(gè)數(shù)據(jù)系列(數(shù)據(jù)系列:在圖表中...
這篇文章介紹的主要內(nèi)容是,利用Python pyecharts去繪制柱狀圖,涉及到內(nèi)容知識(shí)點(diǎn)還是比較的多的,那么,具體需要怎么操作呢?下面就給大家以案例的形式,去做一個(gè)介紹,大家仔細(xì)的閱讀下。 主題介紹 pyecharts里面有很多的主題可以供我們選擇,我們可以根據(jù)自己的需要完成主題的配置,這樣就告別了軟件的限制,可以隨意的發(fā)揮自己的藝術(shù)細(xì)胞了。 圖表參數(shù) '''...
閱讀 911·2023-01-14 11:38
閱讀 878·2023-01-14 11:04
閱讀 740·2023-01-14 10:48
閱讀 1983·2023-01-14 10:34
閱讀 942·2023-01-14 10:24
閱讀 819·2023-01-14 10:18
閱讀 499·2023-01-14 10:09
閱讀 572·2023-01-14 10:02